ShadowGrowth — The Essay
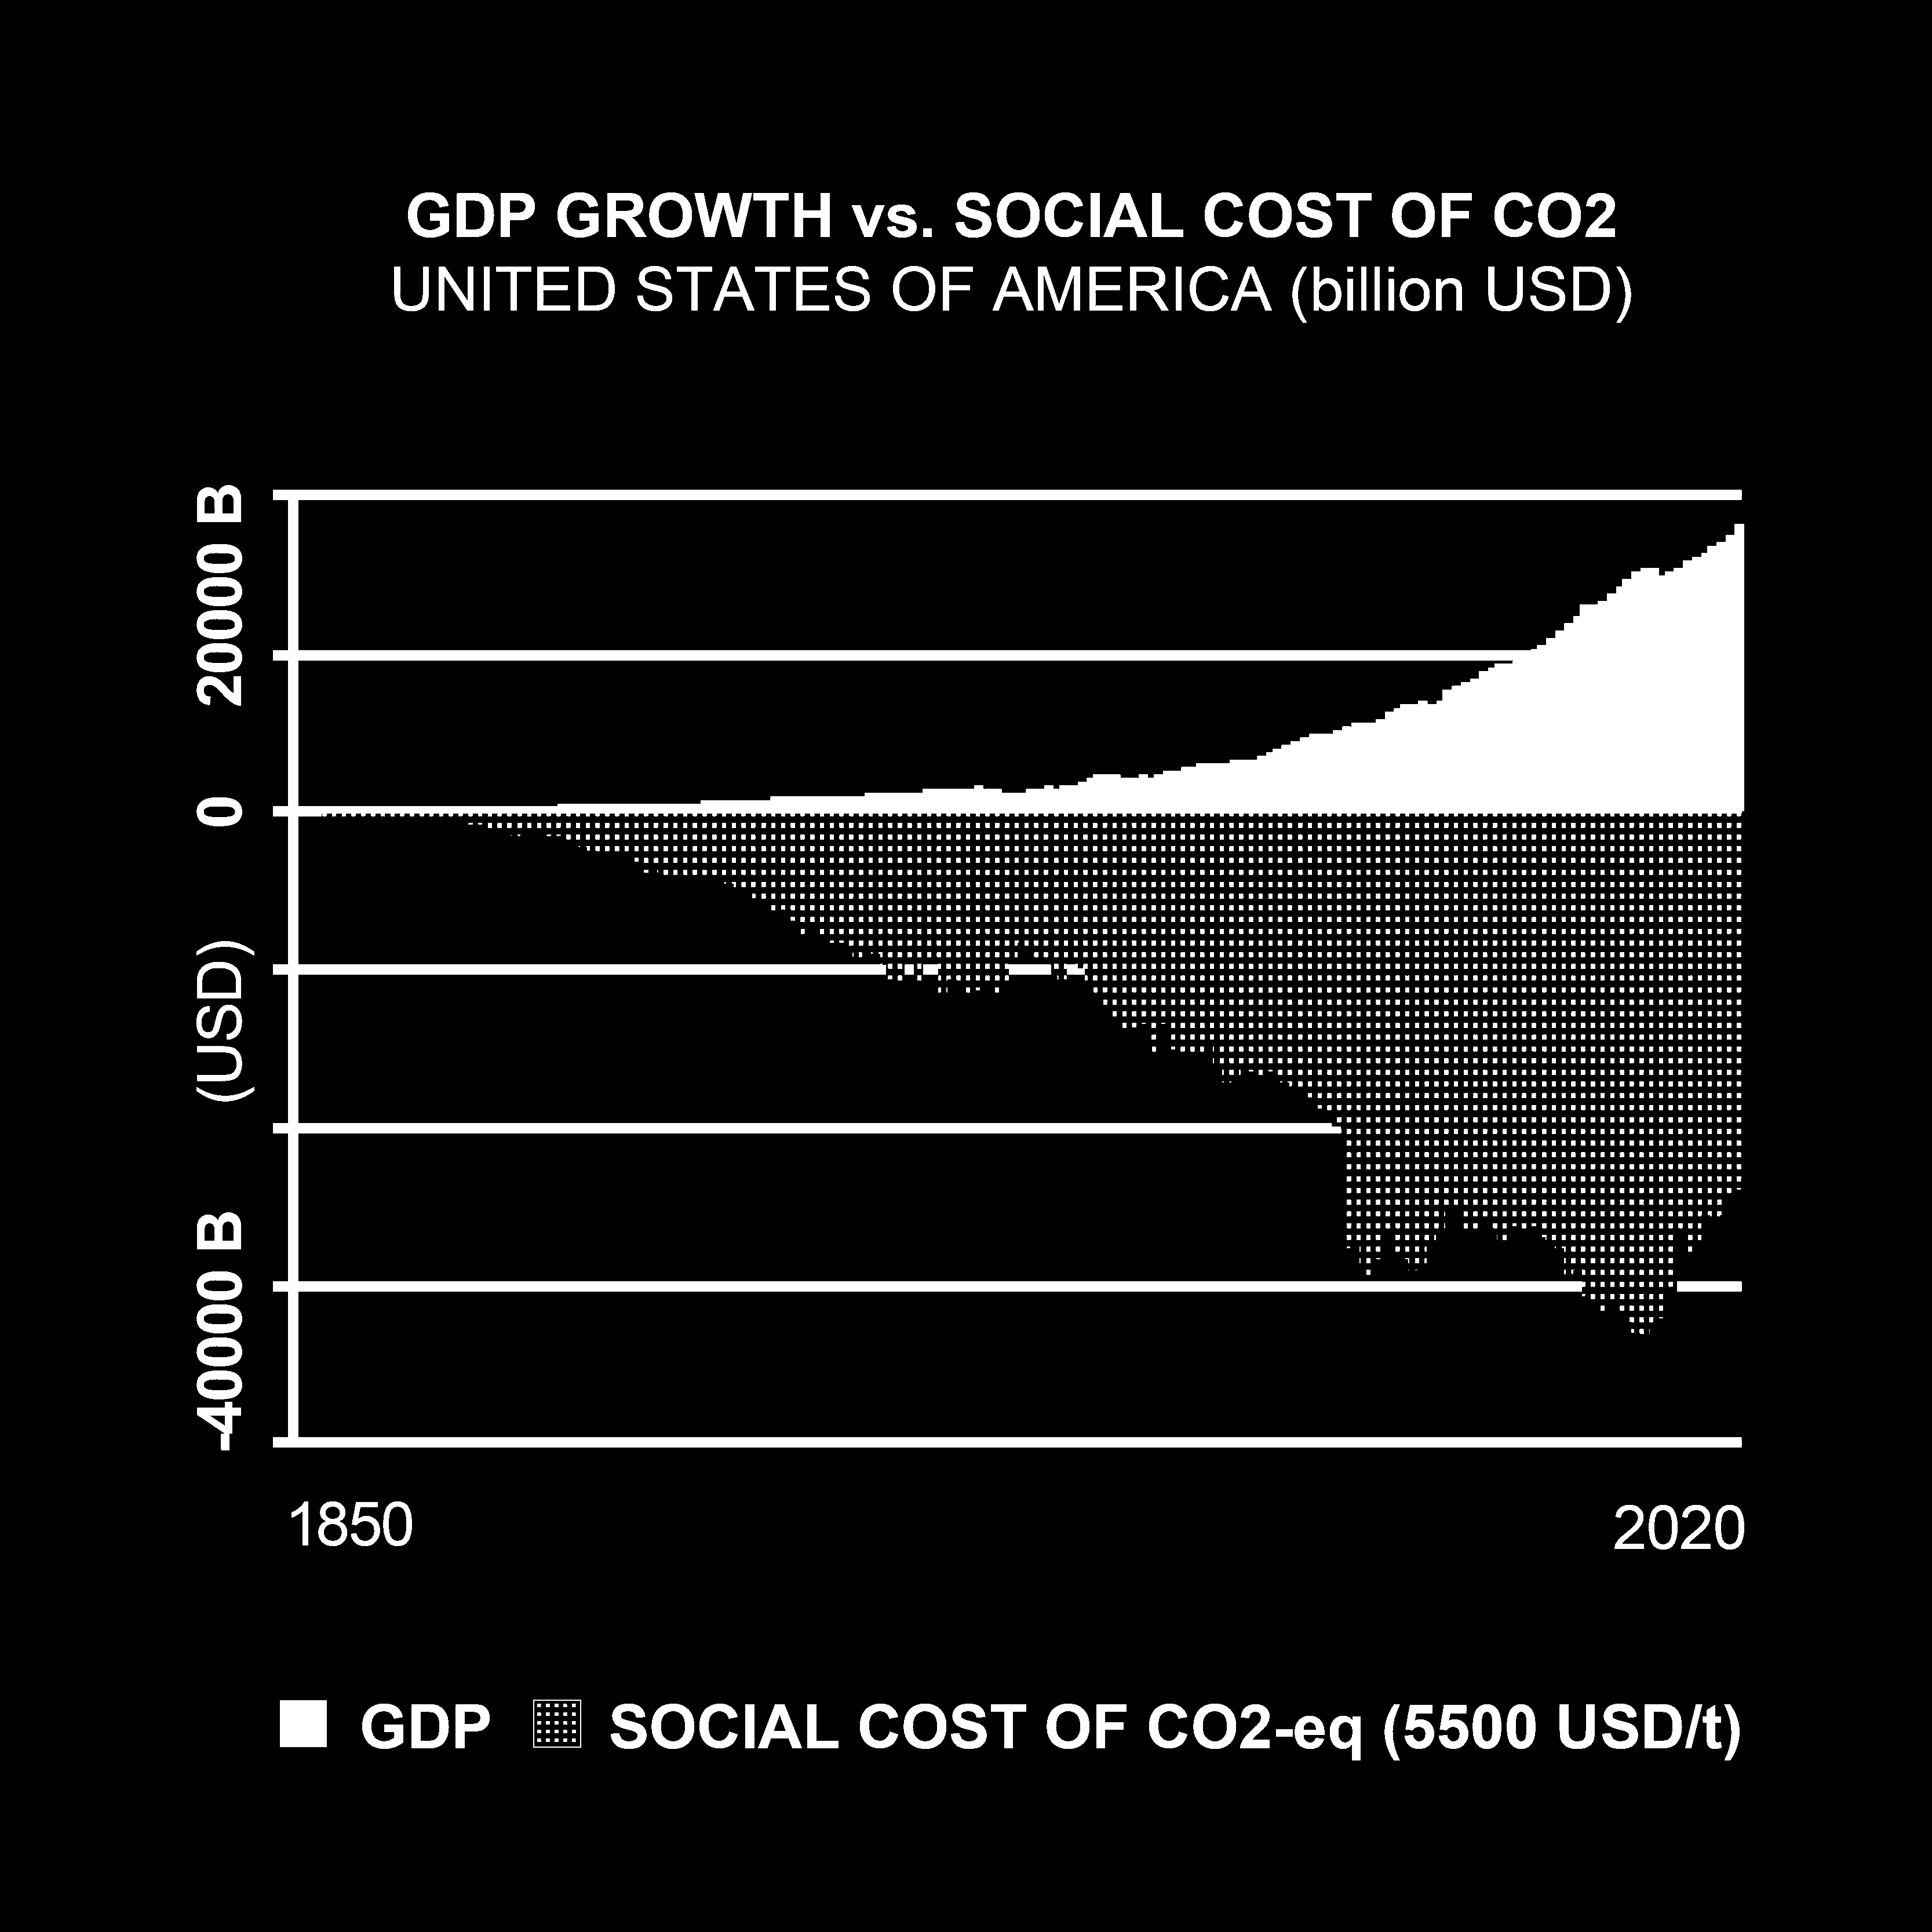
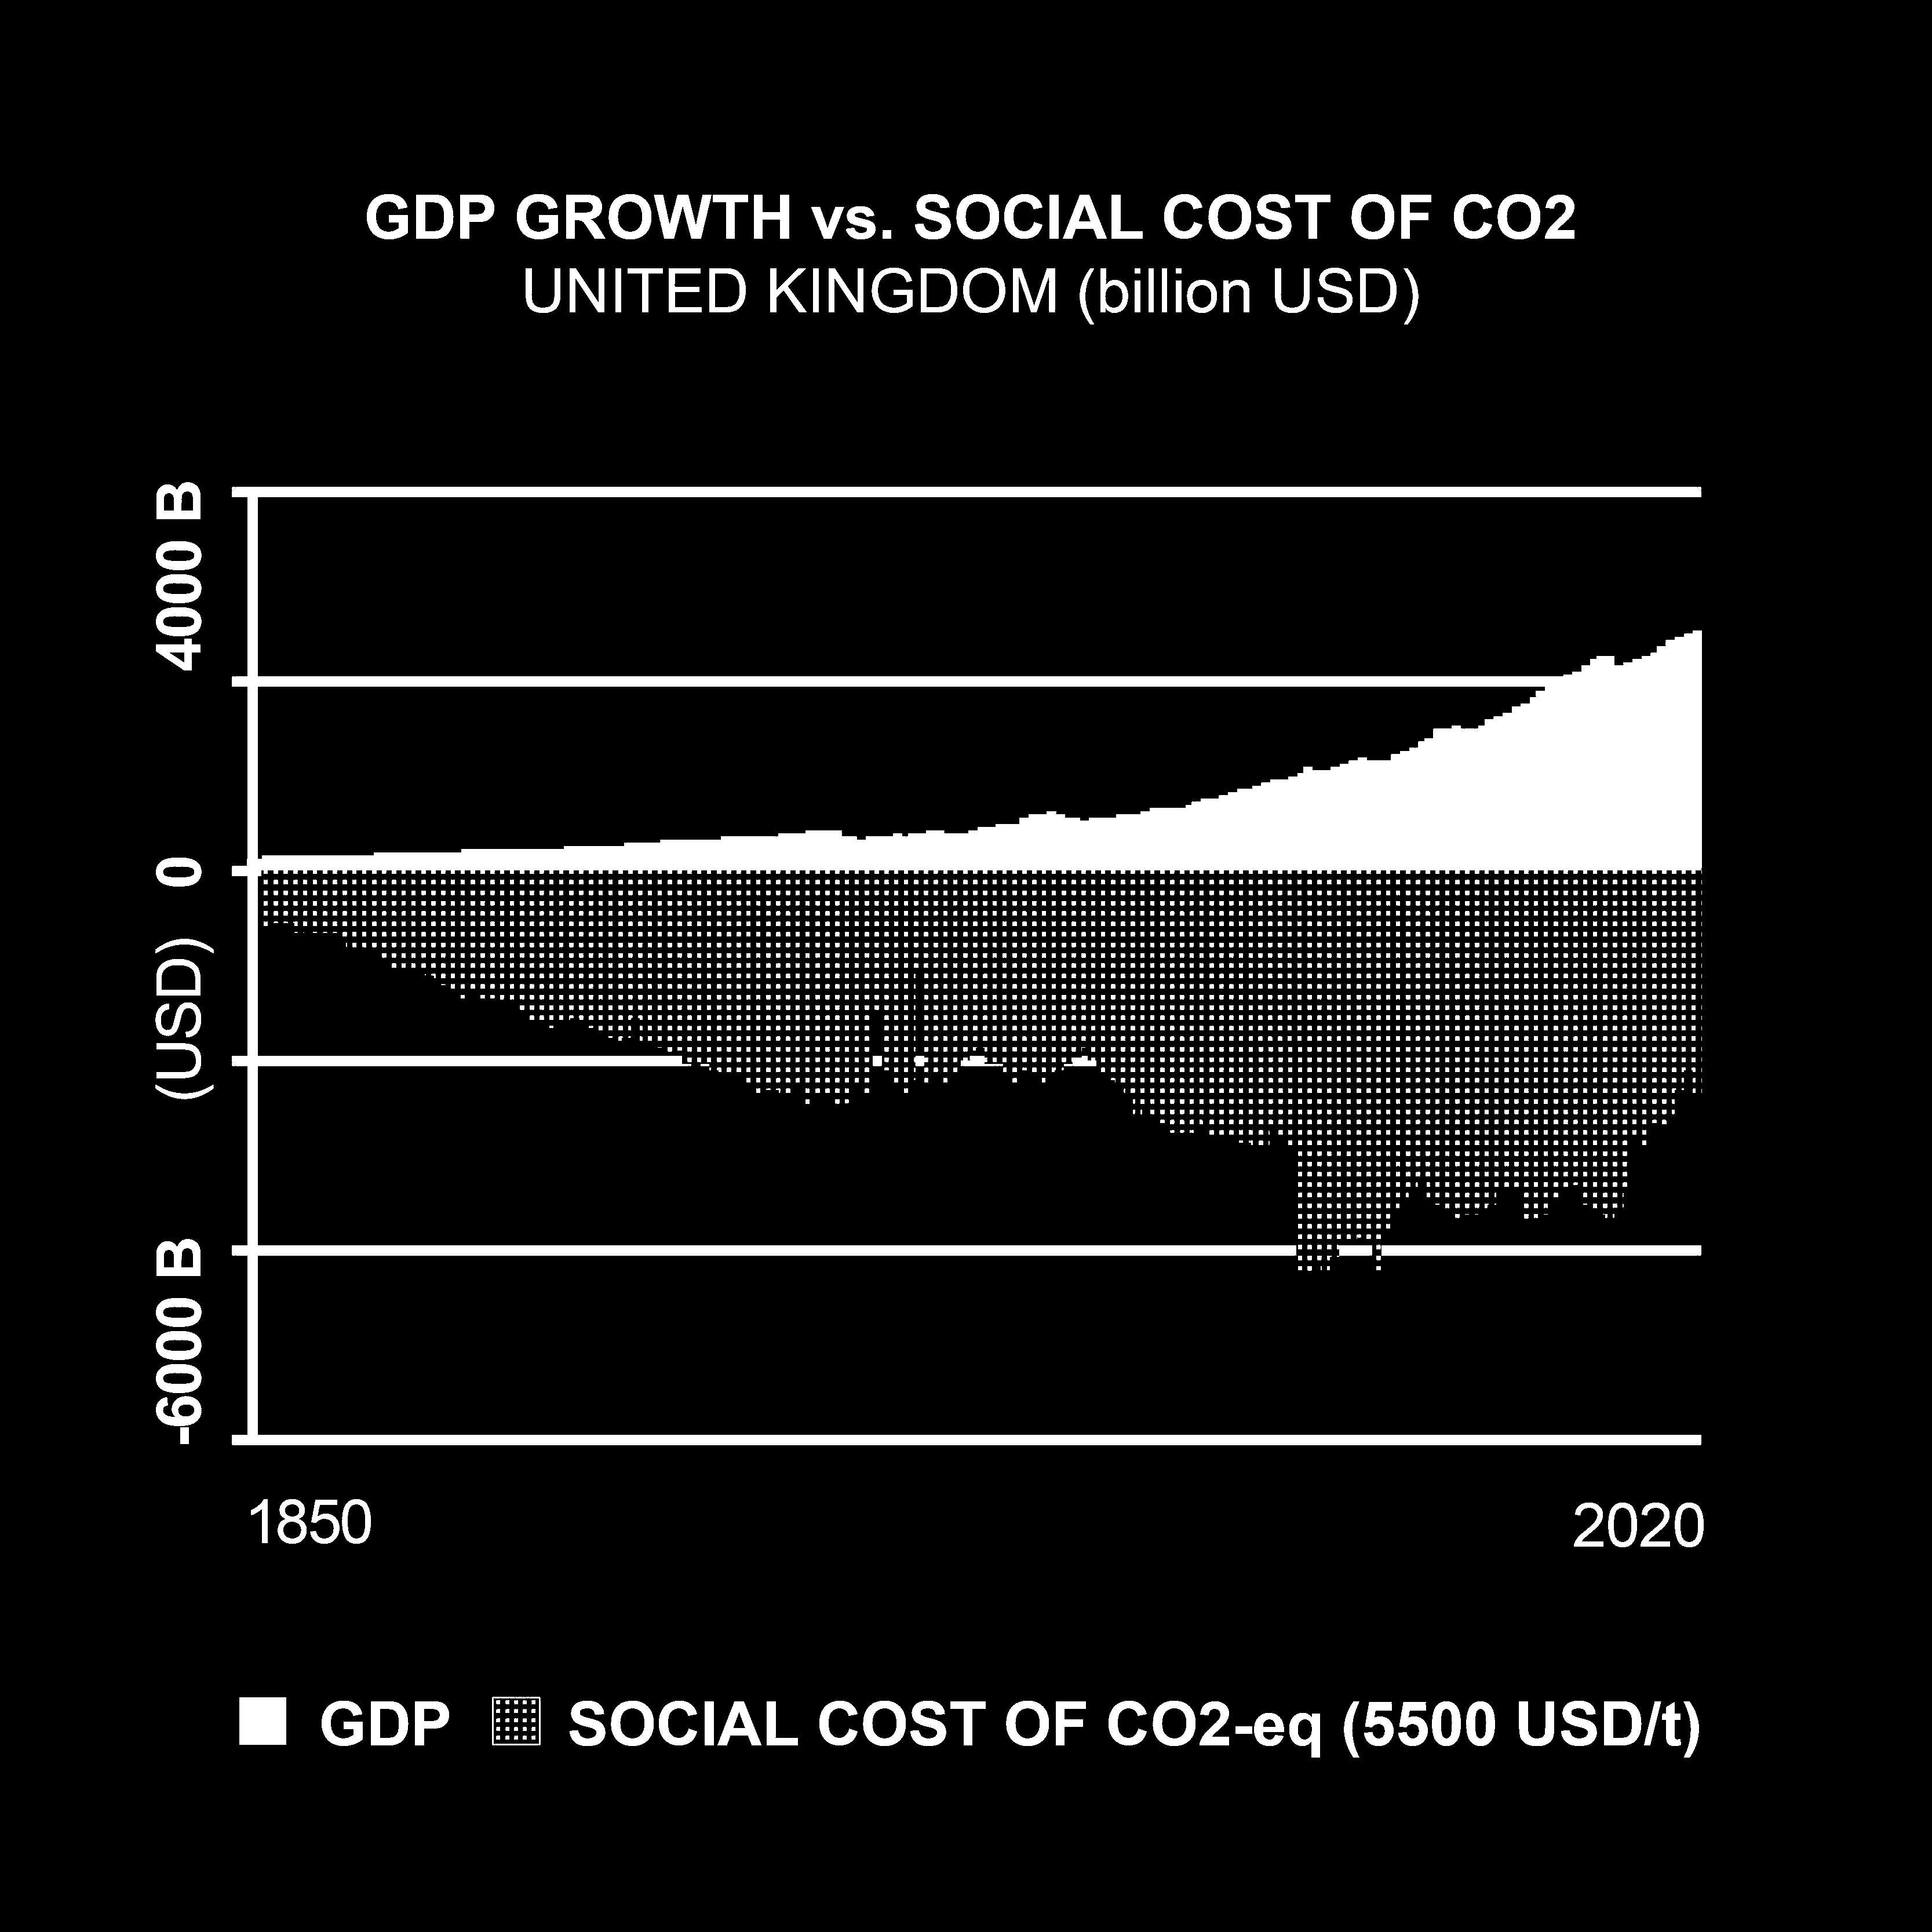
GDP & The Social Costs of CO2 Emissions
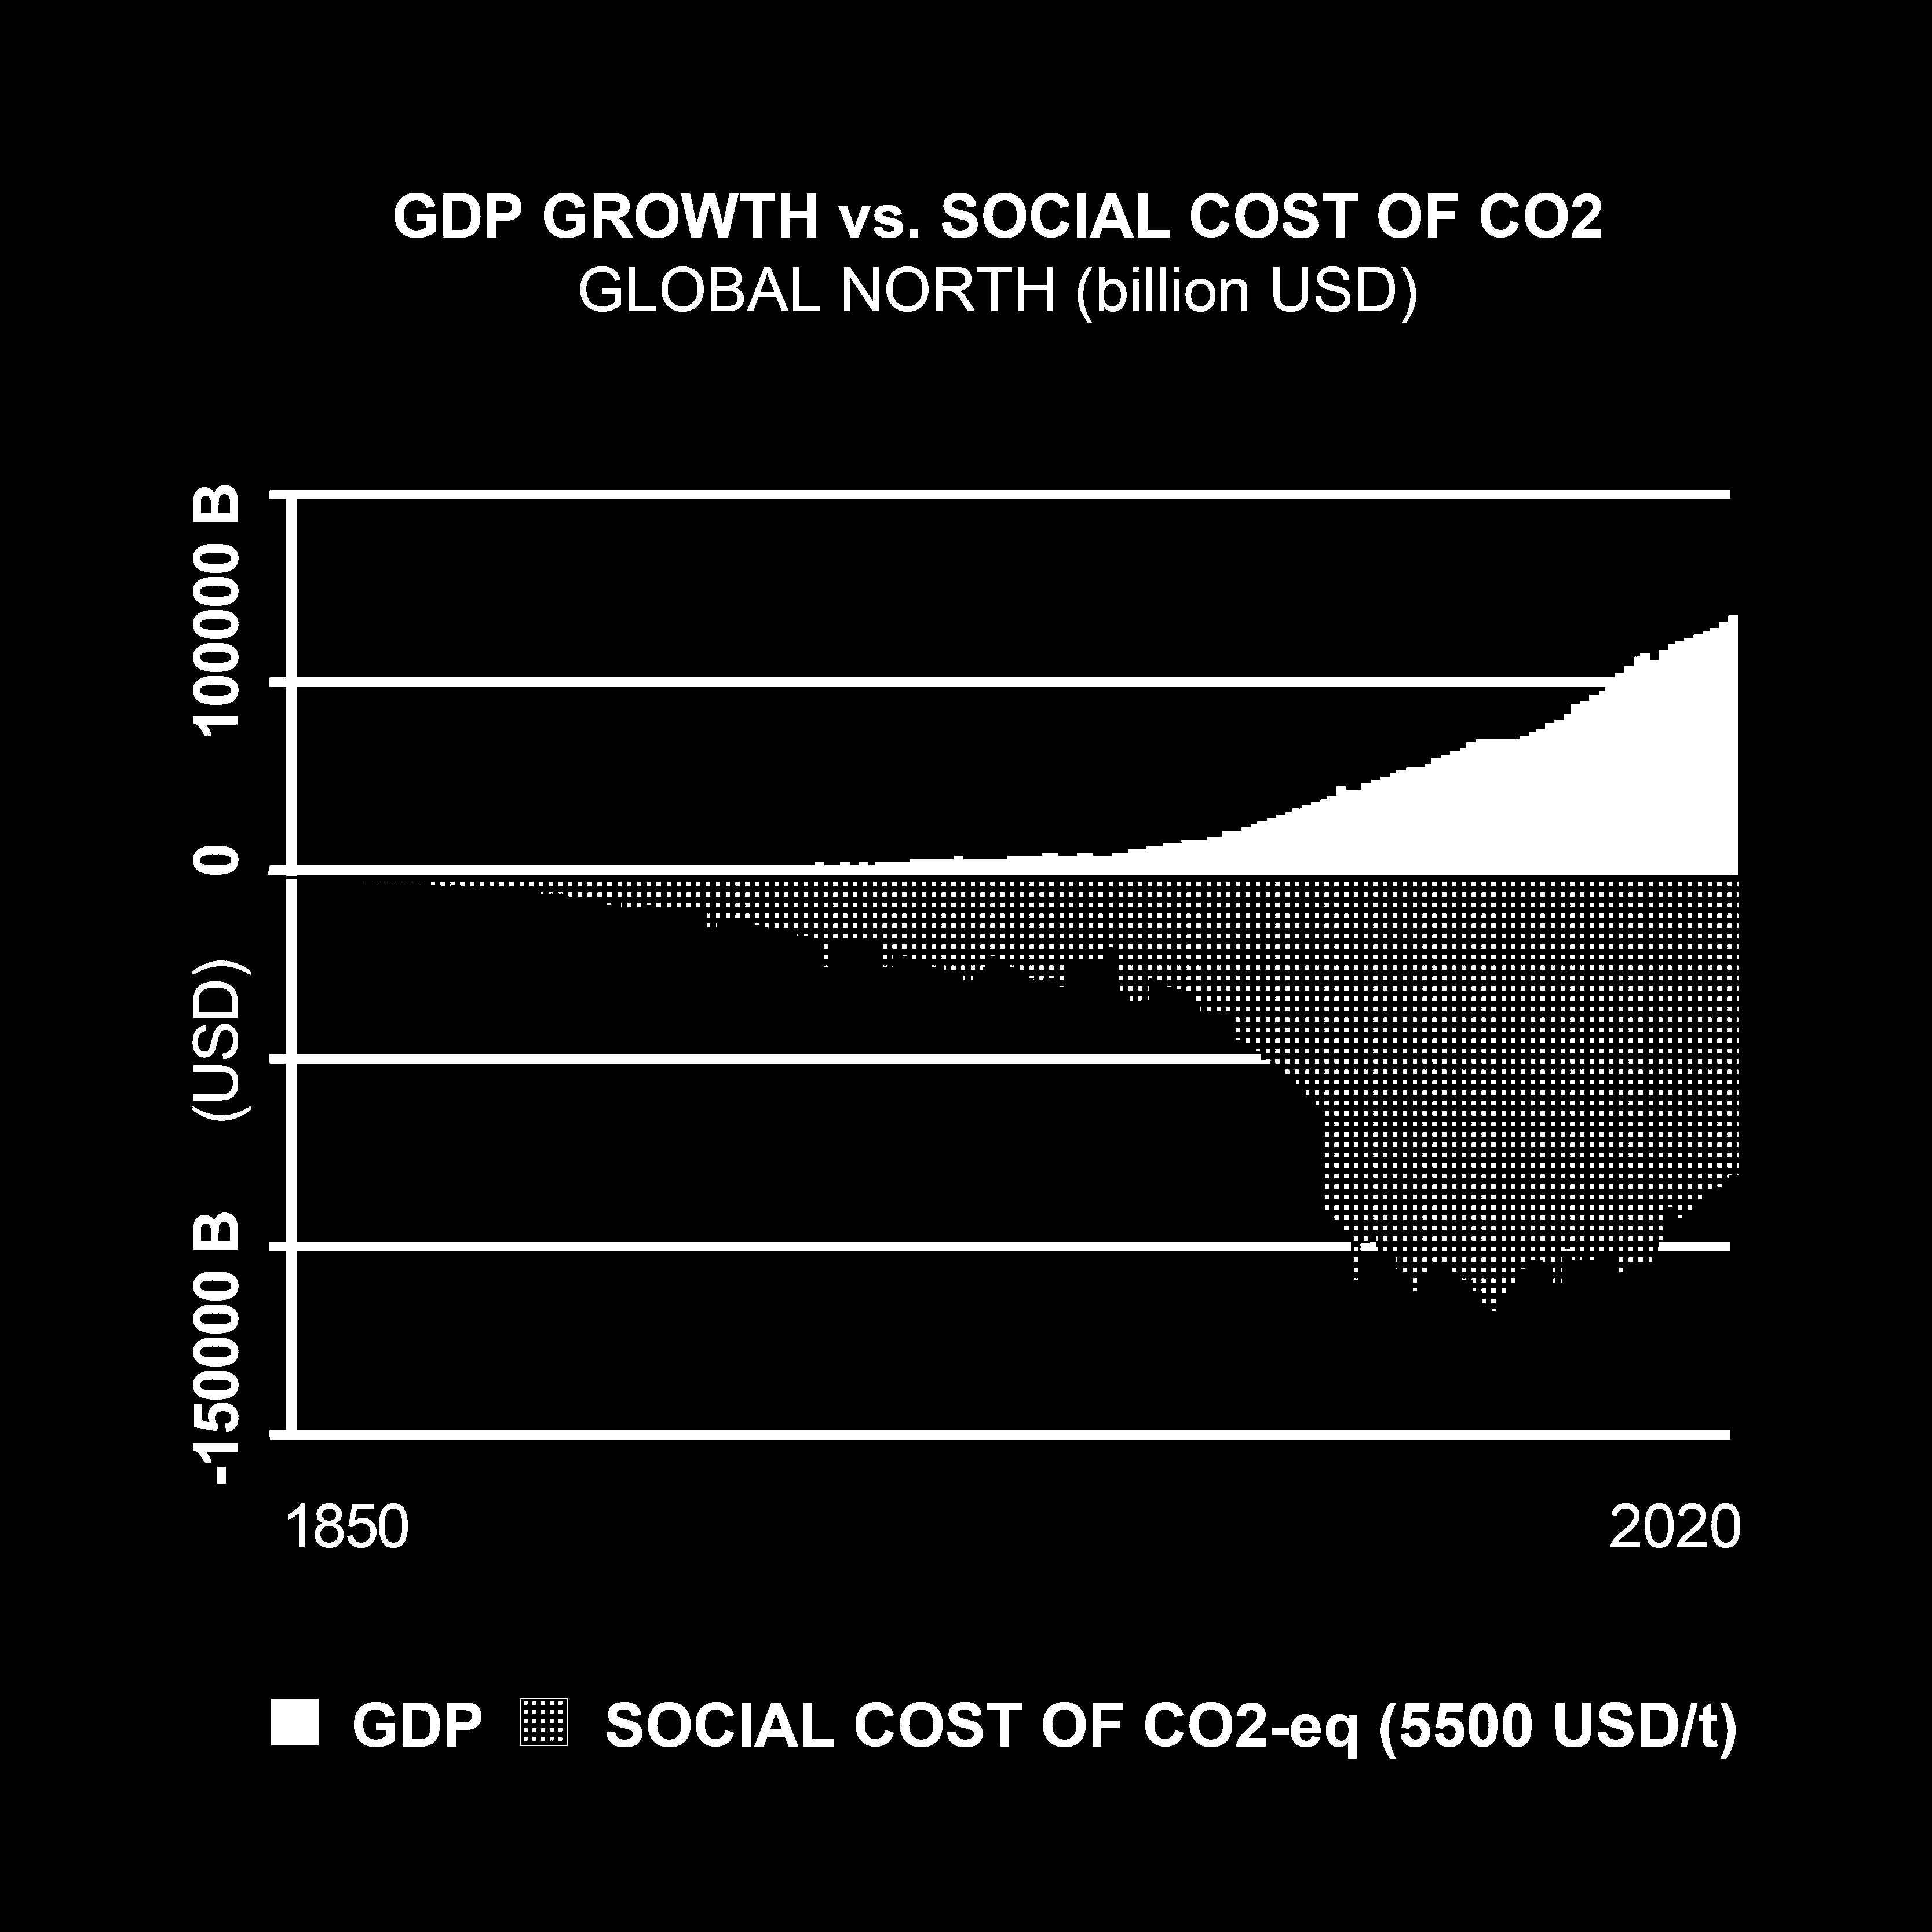
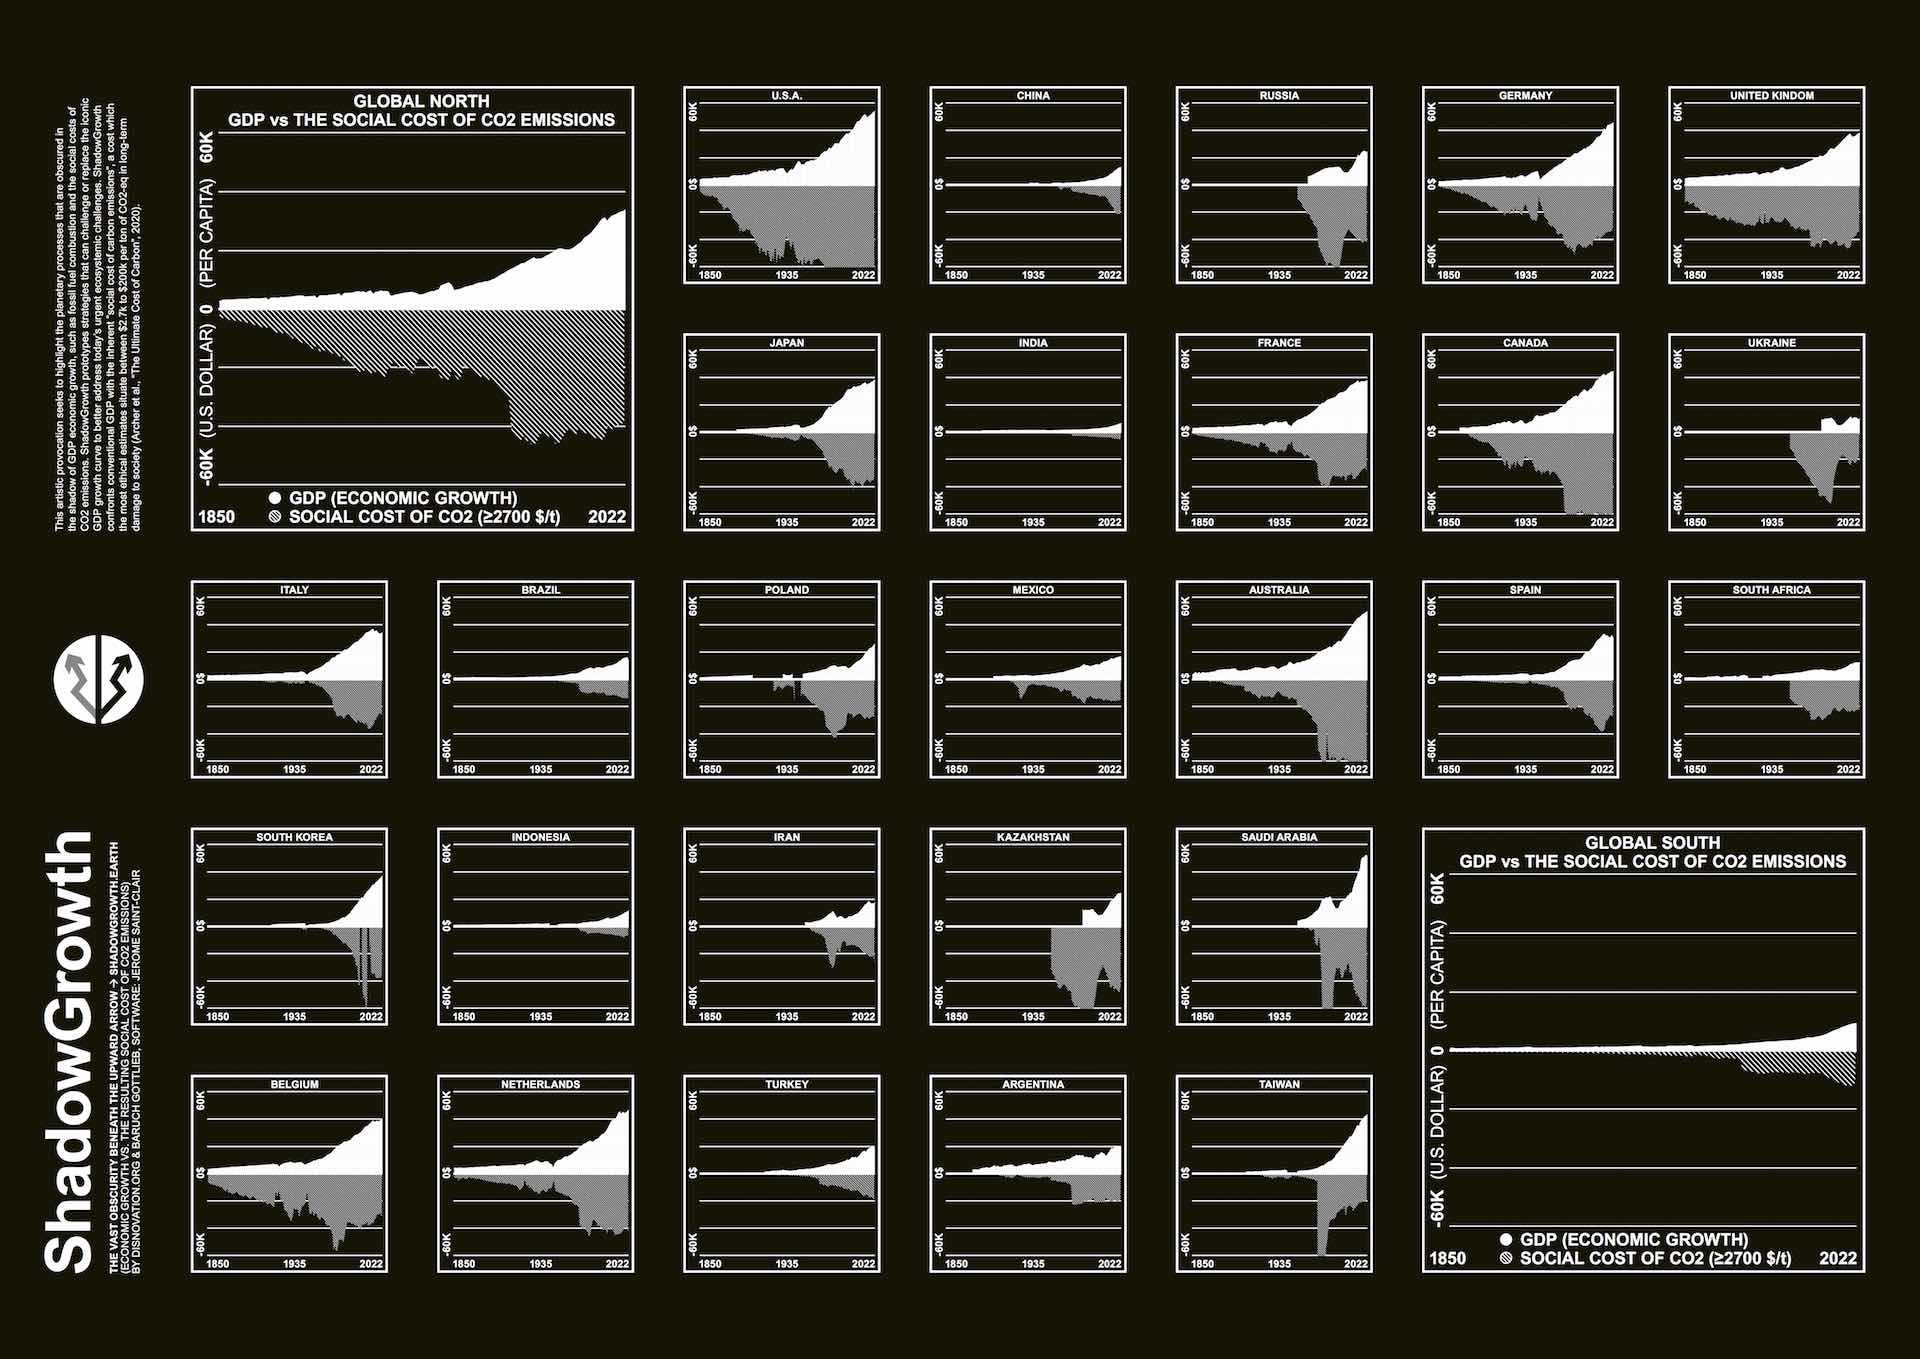
GDP and Social Cost of Carbon -- Global North
[1] MODELS CREATE SHADOWS
We can understand representations of economic growth as “photographs” of the economy. Because they are synthesized from data, economic data visualizations have the same status as images of other invisible phenomena like viruses or bosons. Like an X-ray, such images can be read by specialists, who infer from learning and experience, the vital data missing from the visual representation. But as it is common to arbitrarily fill in missing or unknown information with associations and assumptions from one’s own understanding or imagination, such images can be very deceptive. The Shadow Growth project attempts to address this information gap by virtually submitting economic representations to “real world” conditions, such as lighting and physics, adding dimensionality to the abstractions. In the prototype we present in this project we use the “light” of various studies that attempt to estimate the social costs missing from GDP[1] calculations. This critical light reproduces the shadows normally hidden behind conventionally flat economic representations like GDP. Surprisingly, once the “social costs” are projected into the model, we can see that the triumphant story of growth is largely counterbalanced by the shadow of damages it has incurred, and that addressing these harms will likely also consummately curtail economic growth.
--
[2] GROSS, DOMESTIC, PRODUCT
Since its introduction as an instrument to monitor and plan the wartime economy in the 1940’s, GDP has become widely used as a measure of economic progress and development. As one of the few terms from economics that is used popularly in the press and every-day conversations, GDP is associated with productivity and growth, all mainly positively laden terms in public opinion. However, as elaborated in the Shadow Growth projections, GDP, like any economic indicator, cannot possibly tell the whole story of the relative health of an economy. As an indicator that is often used to stand in for the entire economy, GDP casts a vast shadow that obscures the material ramifications of economic growth on the planet. The initiator of the contemporary use of the term, Simon Kuznets[2] even warned that GDP should not be used as an indicator of public welfare. Despite general consensus today among economists that GDP as an indicator is insufficient on its own and must be complemented by several other methods of reckoning, it persists in public discourse as an indicator of economic health, and is weaponized to obscure alternatives to the prevalent financialized growth ideology.
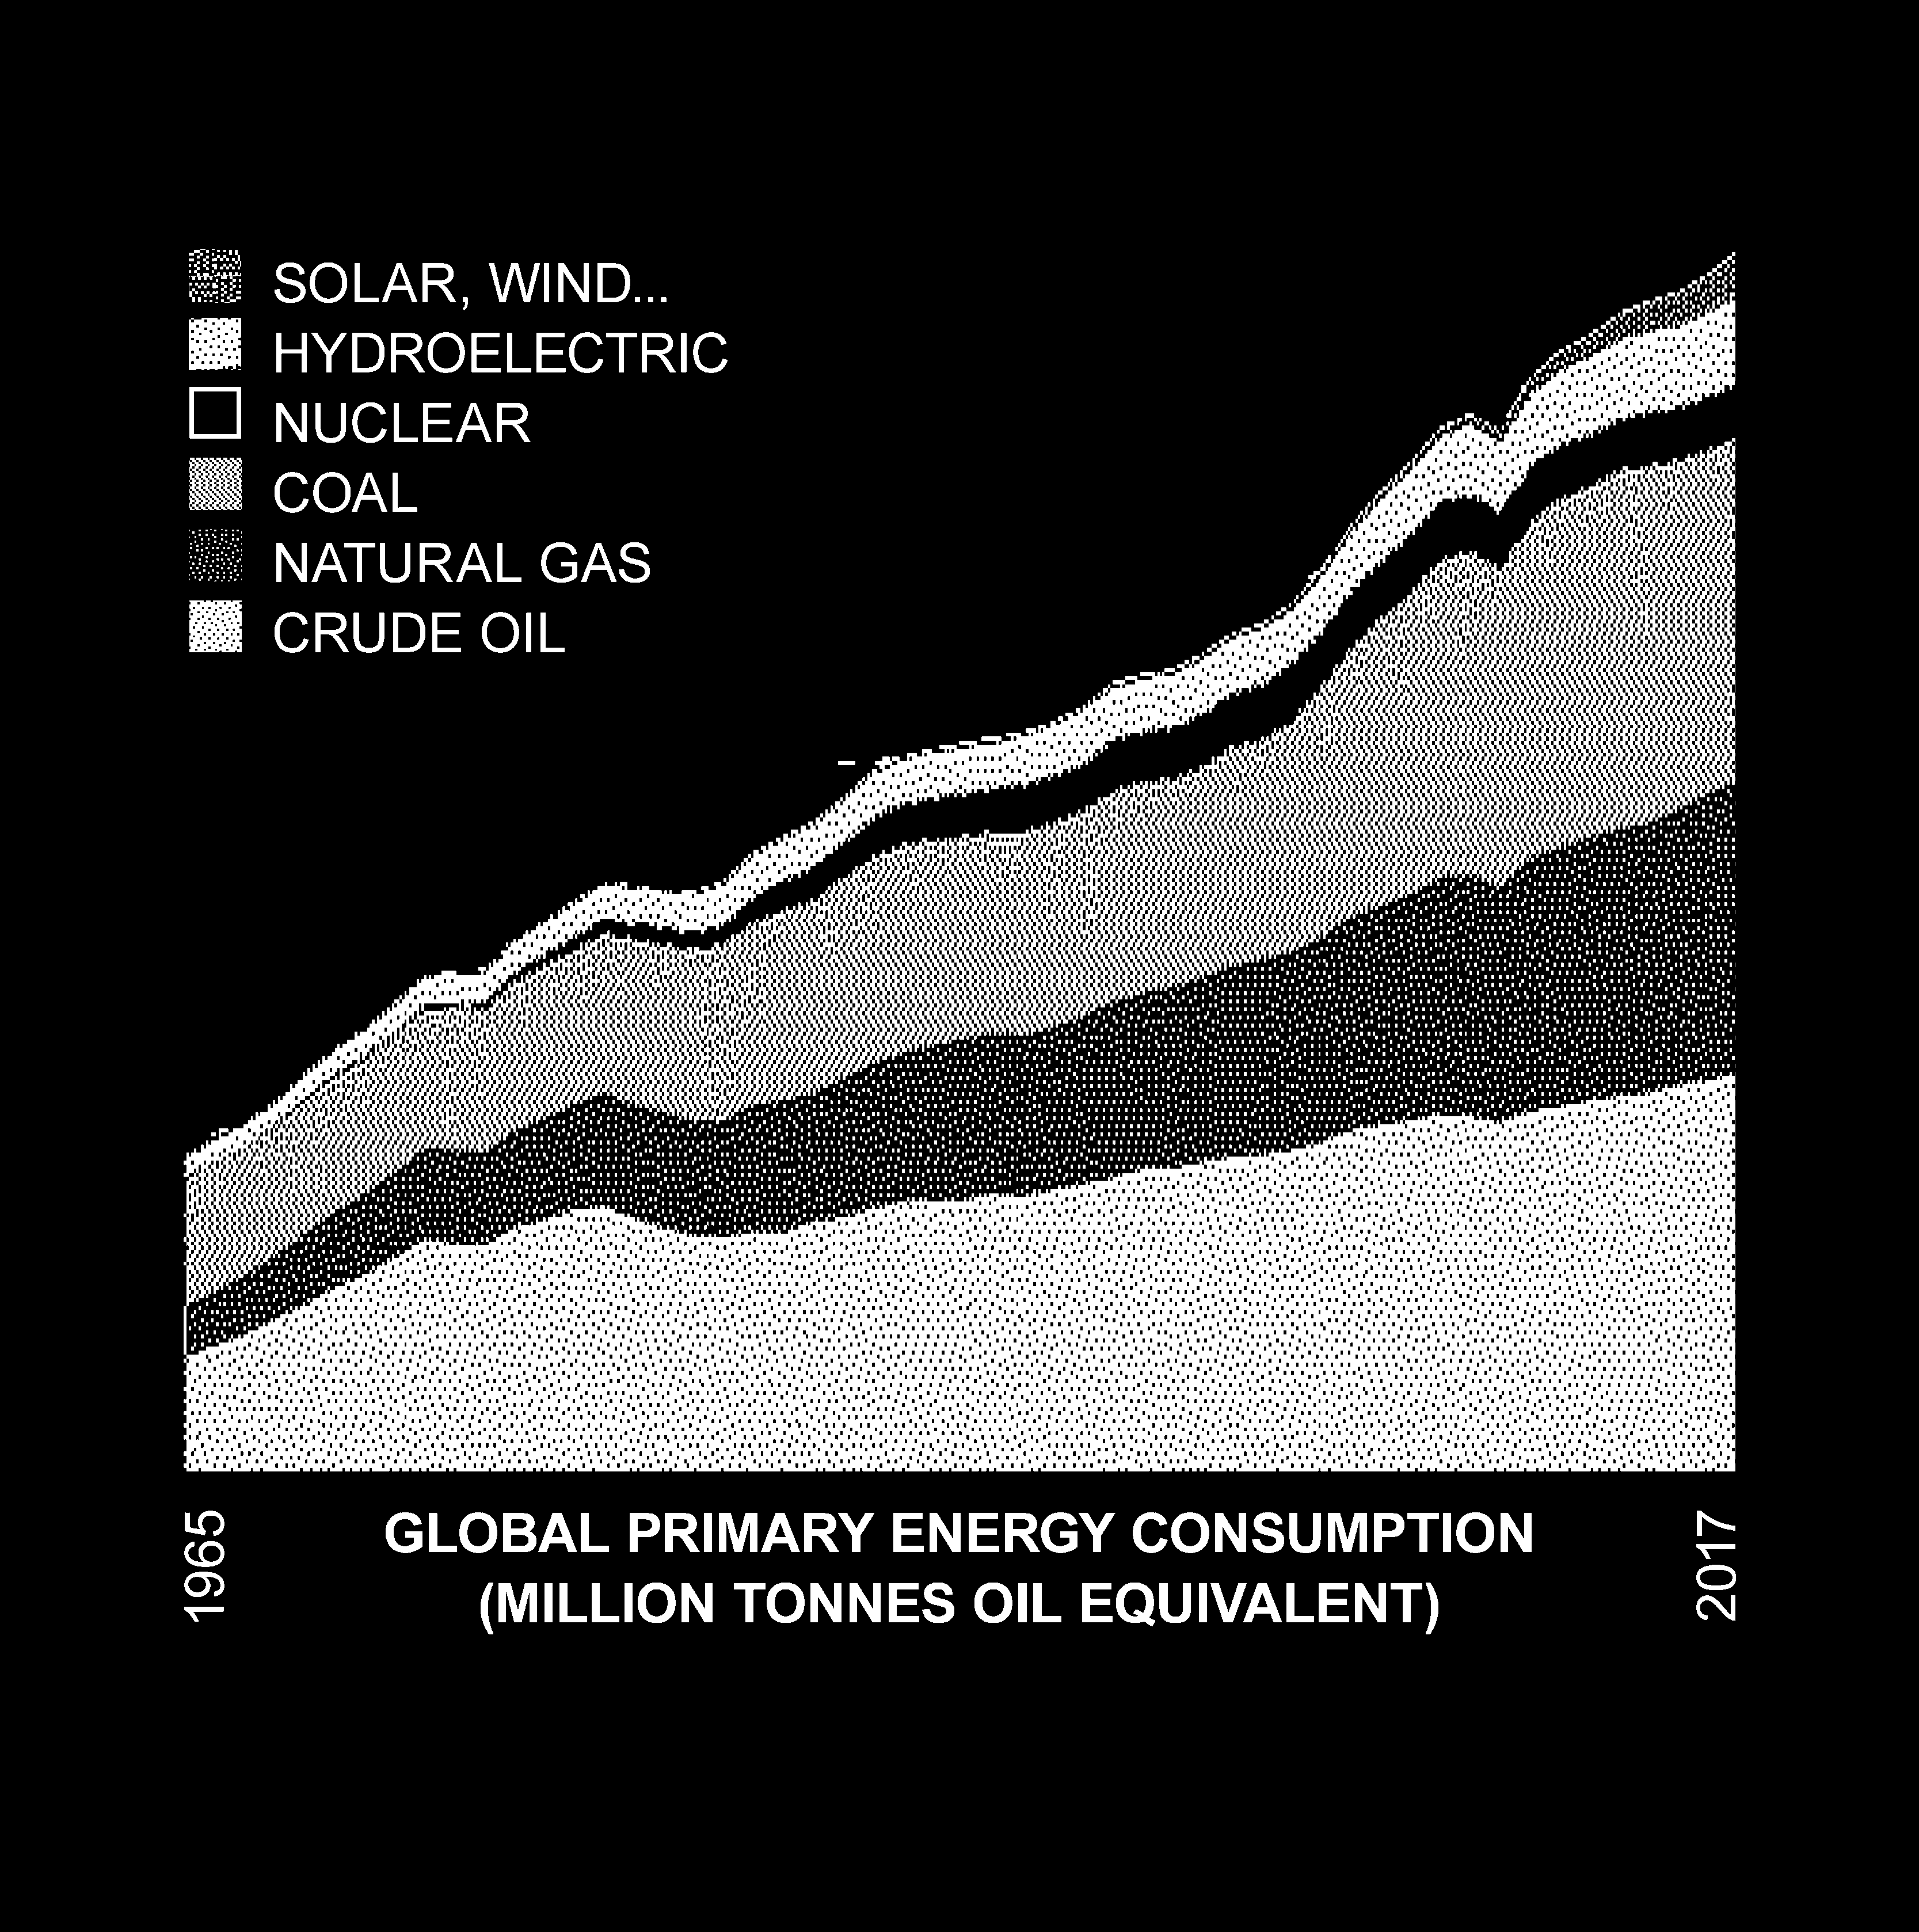
Historical changes in energy resources have essentially always been energy additions, not transitions.
[3] IMAG[IN]ING GROWTH
The “Growth Imperative” is a central credo of our time. Growth itself is not necessarily destructive but the prevalence of financialized, debt-driven and accelerated forms of growth have detached capitalist productivity from serving the needs of populations, generating absurd excesses of overproduction and underproduction. Due to an under-studied disconnect between financial value growth and growth in productive activity. GDP growth figures are still universally heralded as harbingers for general prosperity, but productivity indexed by GDP’s productivity does not factor in environmental damage, waste, poverty and other negative externalities. These harms and costs must be borne by people both directly and indirectly impacted, both now and into the future. In this way the representation of GDP growth has a vexed legacy. So much food is produced that it must be destroyed, yet millions do not have enough to eat. Housing is built which lies empty for years, though millions do not have affordable places to live. Yet GDP continues to rise, how?
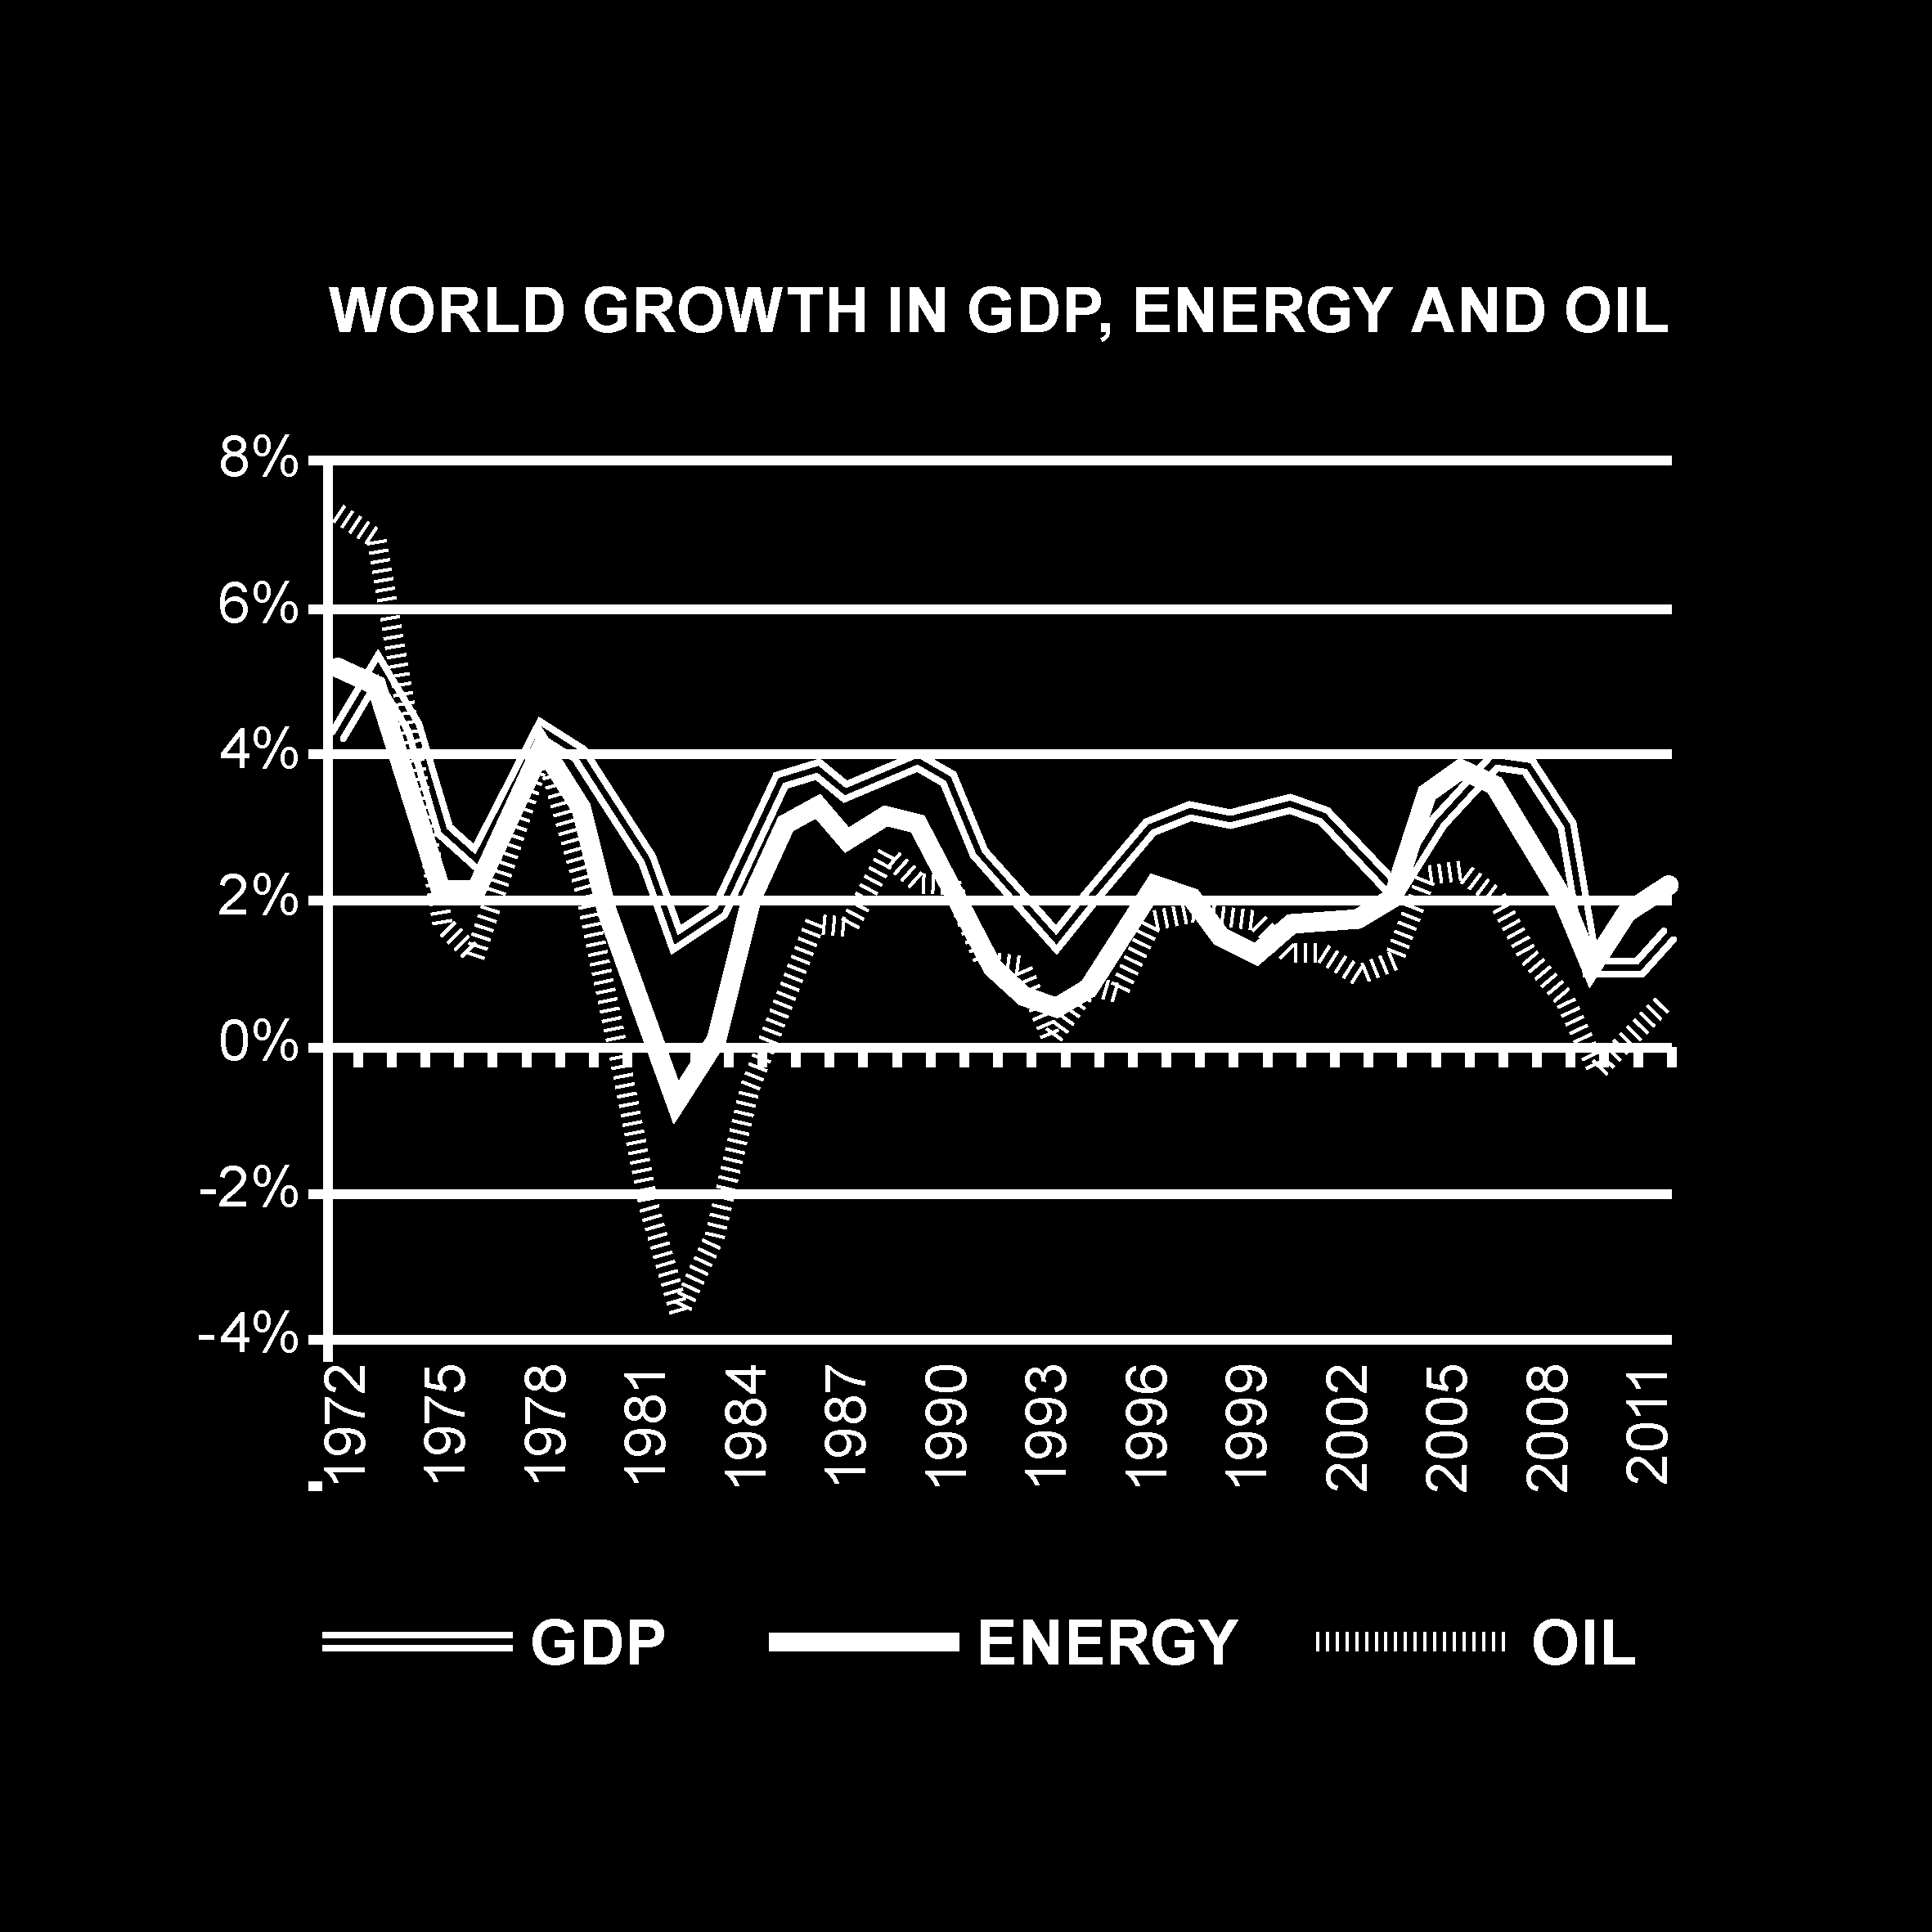
Link between growth and energy consumption.
[4] FOSSIL FUELED GROWTH
Historical surveys by geologist Jean-Marc Jancovici[3] demonstrate that GDP growth closely tracks energy consumption; more energy, more growth, regardless of how efficient or wasteful its applications are. The millions of years of planetary work required to produce such readily available and energy-rich materials as fossil fuels are taken for granted in calculations of added value of industrial production. If we were to factor in the irreplaceable geological and biospheric work of the planet into our calculations of growth we could see how much the claims of increased human productivity through technological progress have been inflated by ignoring increased energy consumption and intensification of resource extraction. As an index of human progress, the GDP story is incomplete. Shadow Growth responds by applying models from three relevant research papers[4] to project a Carbon or CO2 “shadow” missing from conventional GDP calculations. Integrating the shadow into the flat representation of GDP growth, Shadow Growth aims to reveal GDP growth’s hidden legacy and the extent of the challenge to address this.
--
[5] CARBON SHADOWS
The social costs of carbon (CO2) are reckonings of the unexamined biospheric and social processes that are essential to, but not factored into, the figure of GDP growth. The Shadow Growth counter-visualisation experiments are “materialising the photograph” of GDP growth into an imaginary 3D space which compels an account of how the subject of growth is illuminated and what shadows it casts. It aims to partially complete the story of GDP by projecting its carbon shadow. Shadow Growth endeavours to contribute to and nurture exchanges towards a more comprehensive understanding of the complex challenges humanity faces today, and the myriad of other shadows beneath each GDP arrow.
--
[6] THE UPWARD ARROW
The concept of economic growth is represented first and foremost by a rising arrow; often an arrow with a jagged dip or two in the middle. The message of this image is clear, we are on an inexorable trajectory towards general prosperity, towards something better; the sky’s the limit! The jagged dips encourage us to be patient and practice forbearance with the unavoidable setbacks along the way.Anyone can associate that image with their life’s trajectory, starting from the ground and gradually rising to realise their aspirations. This is how images of the non-image-able work. We cannot “see” growth so we use an image that does not represent growth but rather provides us with an opportunity to bring the notion of growth down to human sense of scale and epistemology. The temporality of growth is shrunk and flattened to the time it takes to glance at a chart, but the real temporality is that of the millions of years of planetary symbiogenesis that both produced ourselves and the biospheric affordances, from microorganisms to plants, animals and concentrated into fuels, that we depend upon for energy.
Beyond a certain threshold, growth no longer correlates with an increase in well-being.
[7] ARROWS & TARGETS
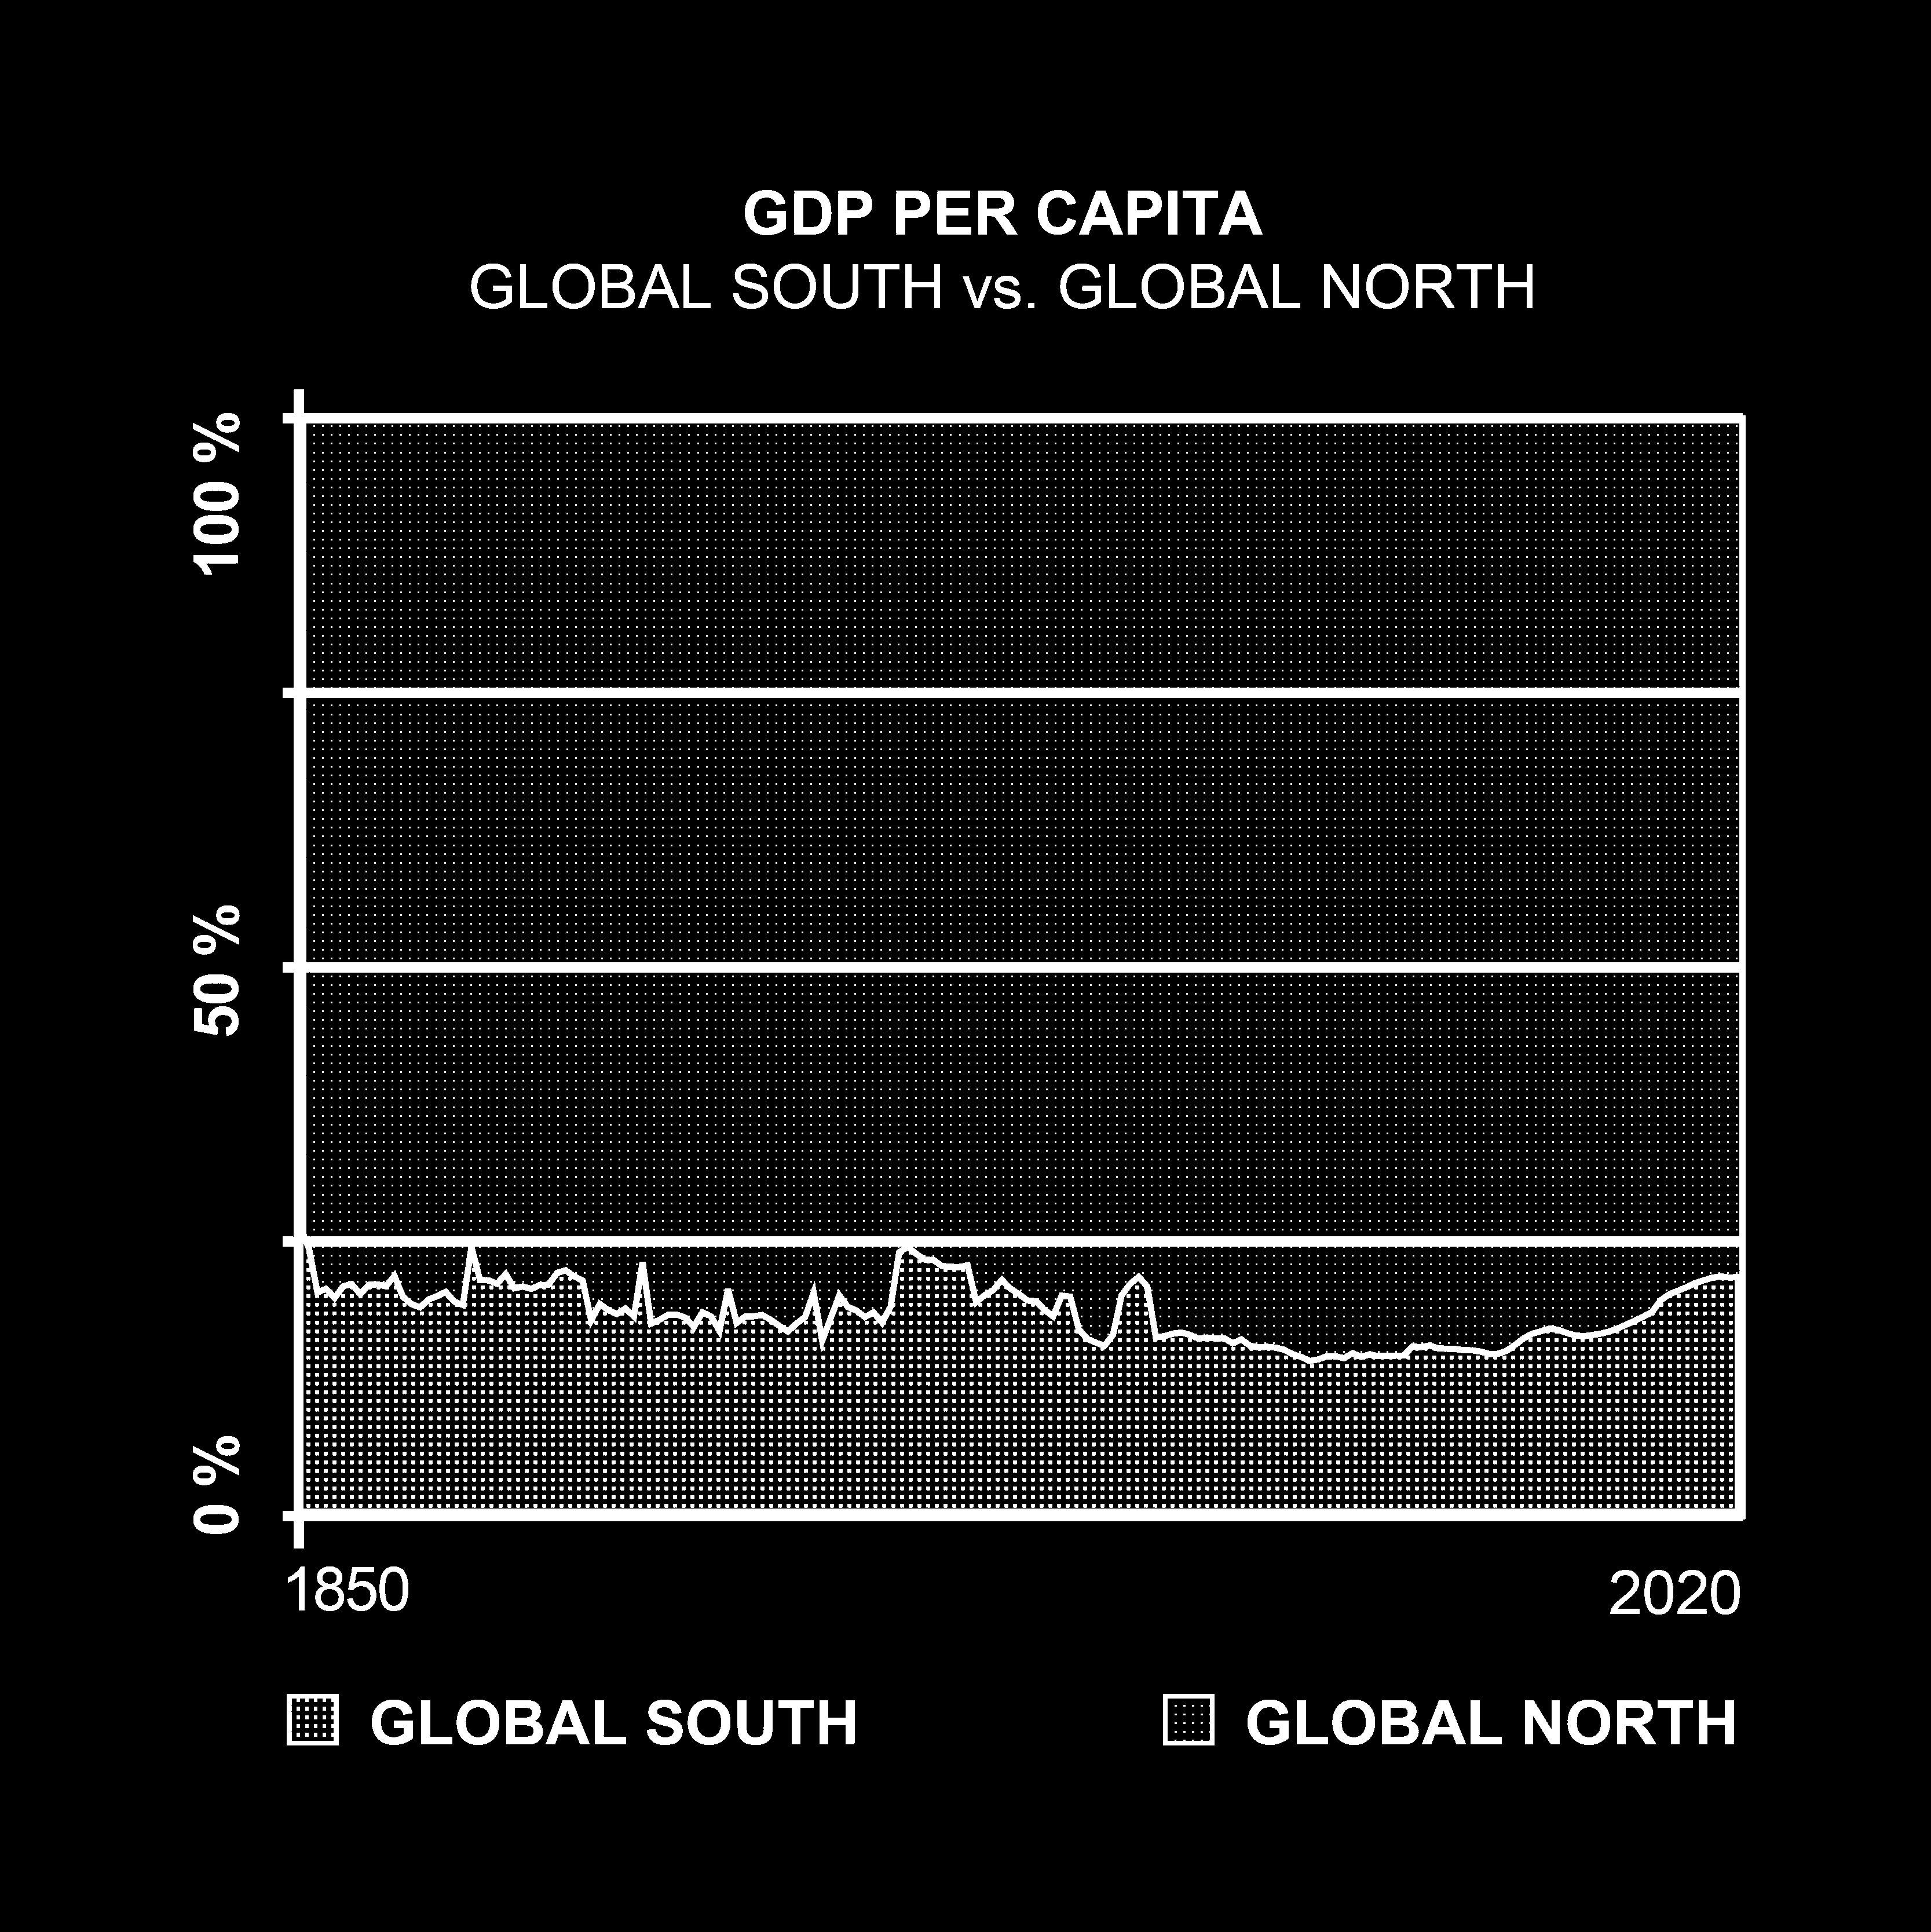
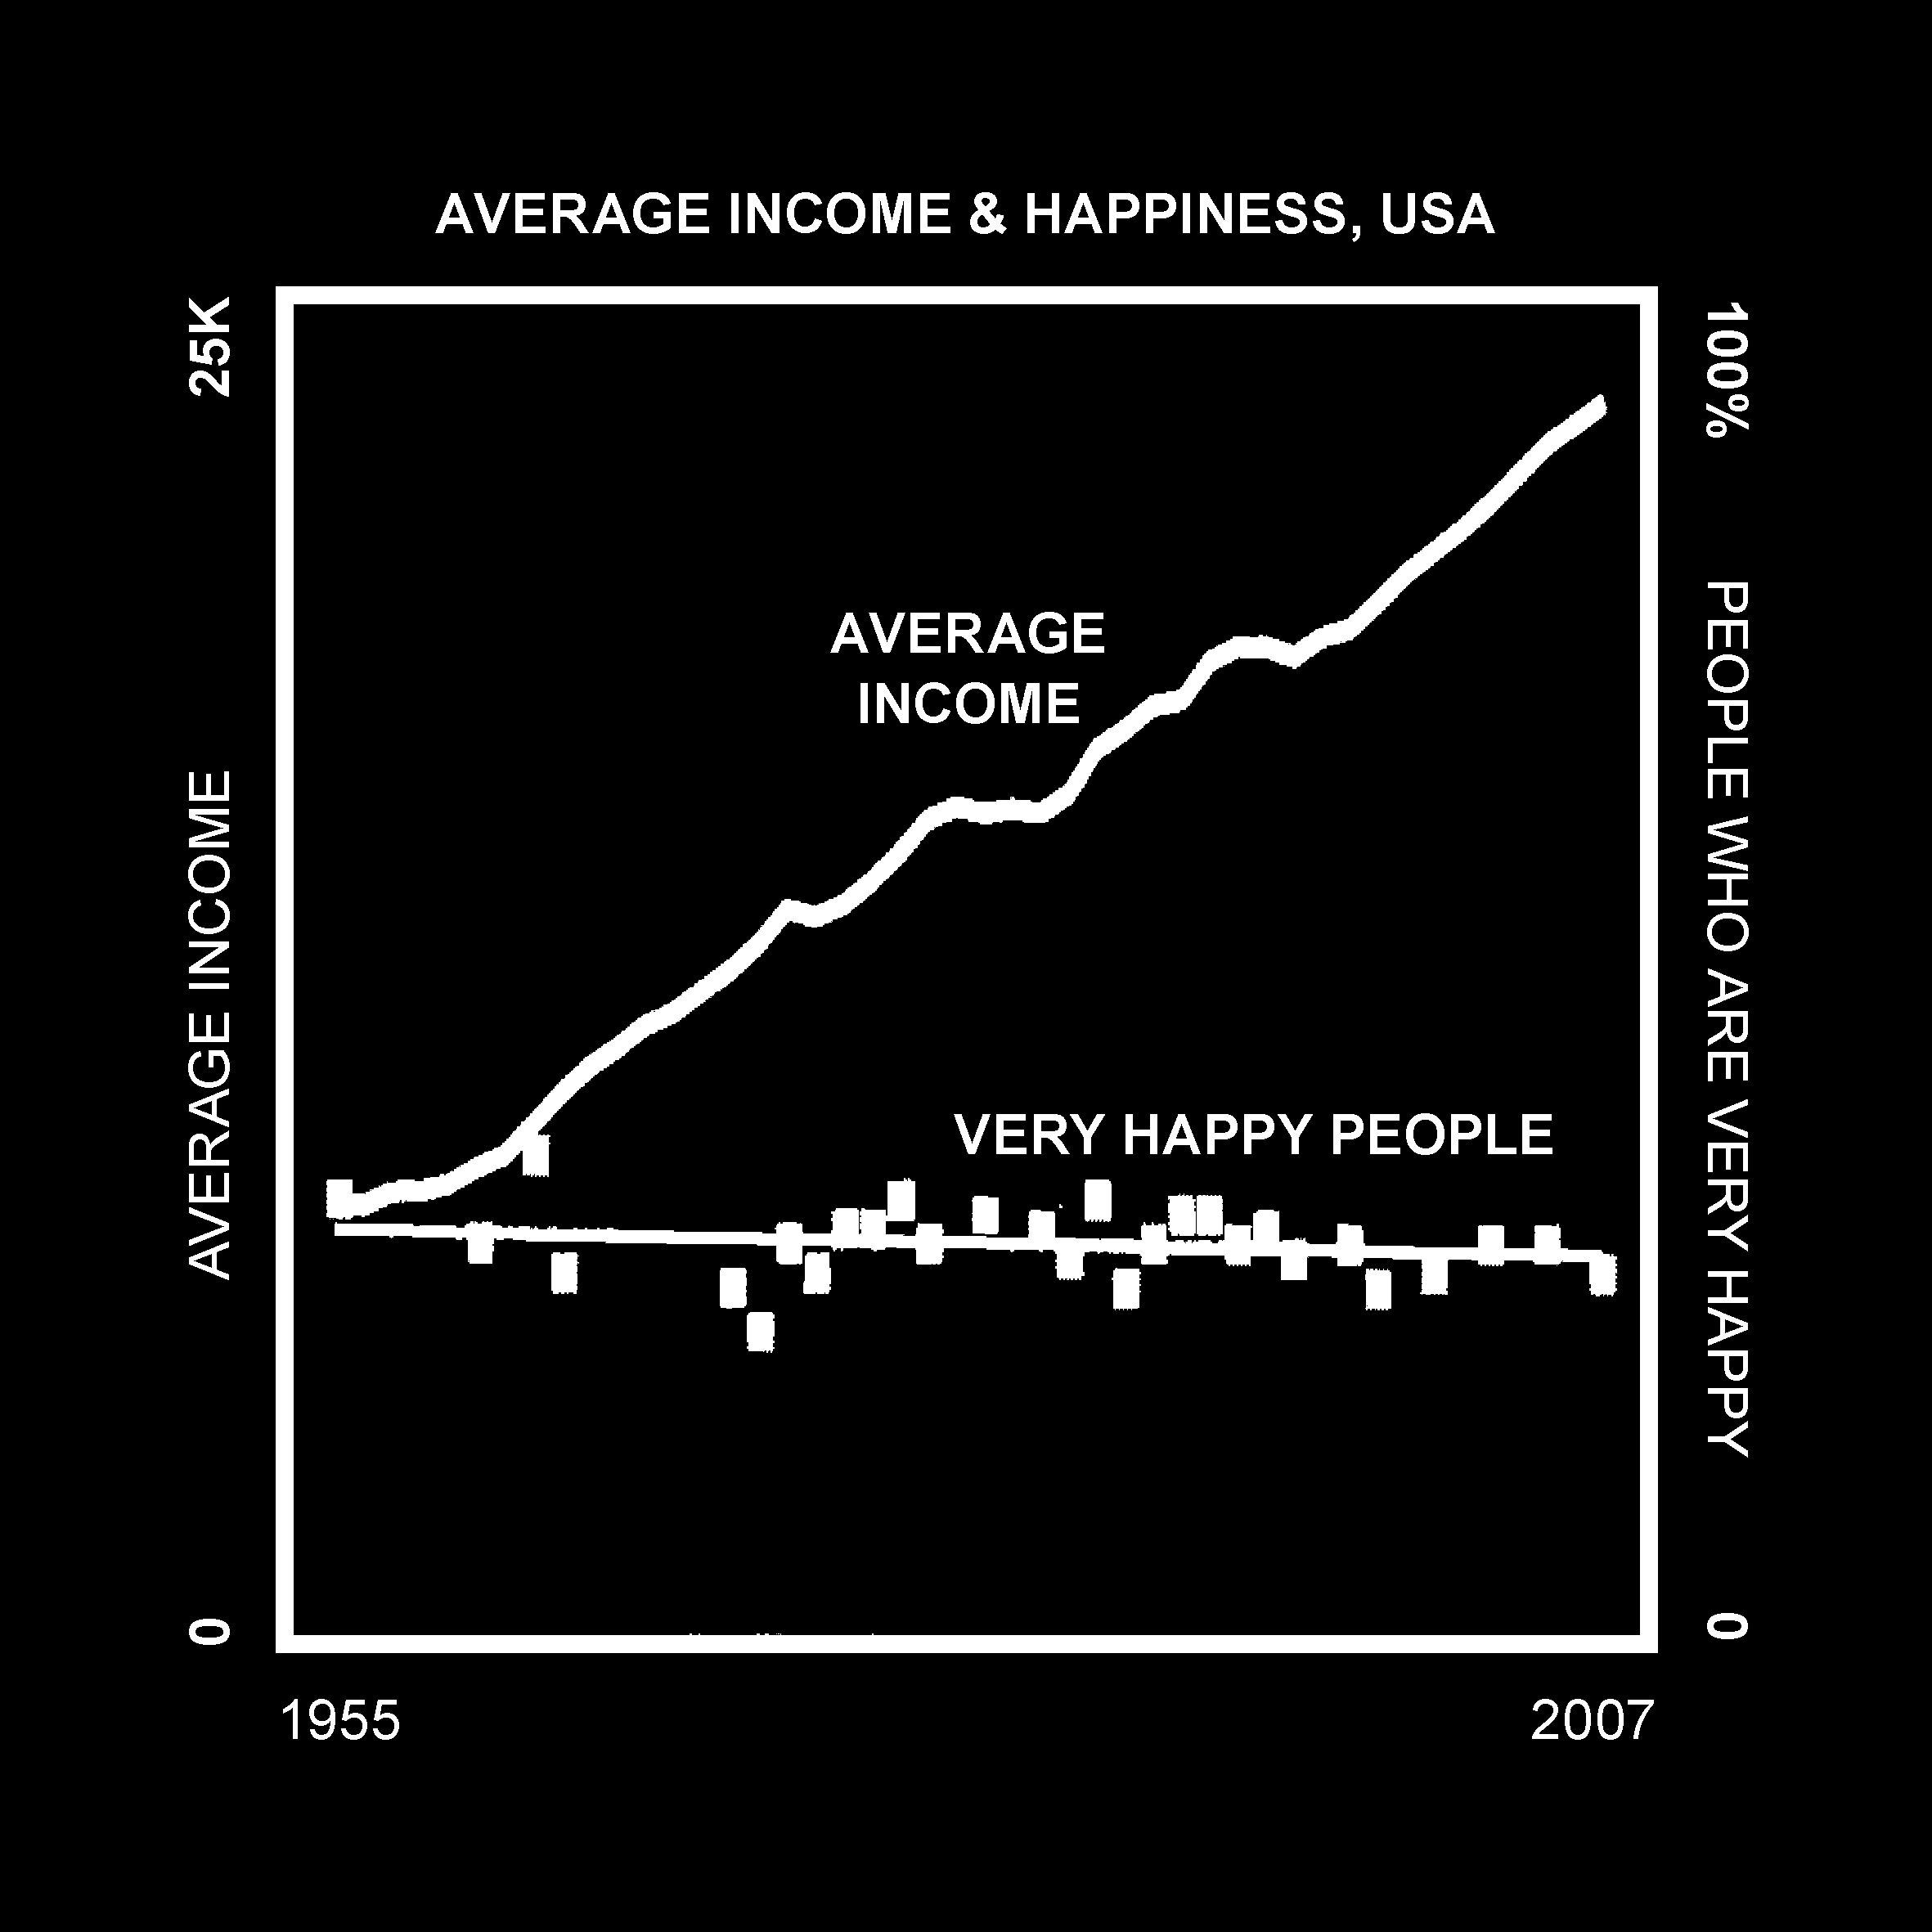
If, according to the latest consensus of the IPCC, we must radically cut fossil fuel consumption in the near term, this will necessarily result in a lowering of GDP and correspondingly living standards unless we can supplement the lost energy from fossil fuel with something else. Though GDP growth has not been shown to correspond to happier populations (see chart), any dramatic drop in economic activity will result in shortages and price increases, historically producing widespread social unrest.[5] As indicated above, GDP historically tracks energy consumption. Reducing energy consumption therefore will likely lower GDP. GDP’s shadow may be a good indicator to why happiness has not increased with GDP growth. Understanding productivity differently, the political challenge will be to ensure good living standards for everybody through the transition away from carbon fuels.
--
[8] THE SHADOW BENEATH THE UPWARDS ARROW
Our positive and hopeful associations with growth imagery play on our weaknesses. Human beings do everything to make sense of the world, and, as far as possible, to make hopeful sense of the world. But the full story of the rising arrow must include its shadow. Increased shareholder value no longer means better conditions for the generality, quite the opposite. The ever more frequent pump-and-dump economic crashes of late-stage capitalism functions by pneumatically pumping value from the public sector, that includes the assumed reproductive contributions of the biosphere, into private hands. A rising arrow not only means more consumption of energy, it means pushing the economy to breaking points whereupon any damages will have to be borne by the public. “Negative externalities” is a category in economics where the costs related to harms, such as environmental degradation, pollution, illness are not borne by the producer of the harms. According to the strategy of “disaster capitalism” destruction of lives and livelihoods can be as profitable as their reproduction and this way it appears as a positive value on the GDP spreadsheet. Similarly, as investors profit by extracting more productivity from workers and paying them less, the upwards arrow we see on the news is bad news for both the biosphere and for the international proletariat.
--
[9] IMAGES CREATE SHADOWS
“Images hide what they are meant to represent” — Vilém Flusser.[6] This is a dialectic we increasingly have to navigate as more and more of the information about the world comes in visual translations of “invisible” data. Every scientific measurement is a gross simplification of the temporally and materially rich, “Thick Present” as Donna Haraway[7] called it. The data must be reconstituted into images for us to understand it. A vital aspect of this project is to critically explore the instrumental function of images, extending from scientific discourse into the public realm of political culture. Today’s thriving image culture online proves Vilém Flusser’s contention that, in the electronic age, when communication takes place at the speed of light “out of scope” of conventional human-scale-based epistemology, rational, logical, causal, literate discourse is no longer adequate to grasp and contend with our condition. We need to use what he called “technical images”. Such images create publics, they bring us together in dialogues where we can help each other grapple with the pressing challenges we confront. To reappropriate the legendary statistician George Box’s aphorism about model-building, we could argue that “all images are fake, but some are useful”.[8]
--
[10] SHADOW GROWTH
In a recent article, Umair Haque[9] noted how rapidly rising steel prices herald the end of carbon freeloading by industry and ensuing shortages for both consumers and producers. One of the main lessons from the Social Cost of Carbon papers is that the economic growth and high living standards that characterized the post-war period can be attributed to increased energy consumption, particularly fossil fuels, which are extracted from the earth for free. With global warming, climate disaster, and the sixth extinction, the planet is issuing a long overdue invoice. But who can pay? And more importantly, where is the planet’s bank account? There is strictly no capitalist relation between the earth and its inhabitants, there is no way to pay Nature back for what it provides. The shadow of growth cannot be consummately addressed monetarily. As an artistic provocation, Shadow Growth reveals the delusion of growth we have been living in for decades. The CO2 shadow projections are to be understood as use cases or prototypes for how to open the field of public debate for a reevaluation of the legacy of growth, helping us encounter its many shadows, including biodiversity depletion, rising sea levels, and other long term damages. Part of confronting the global climate crisis requires completely re-evaluating the ways we have understood our world. An an-anthropocentric ecology and economy reveals us as bit players flailing vainly in a grand cosmic material flux. Art plays a crucial role here. In a world where images do not only inform but are also active in social praxis, new forms of proactive data aesthetics are required to contest for the dominant narratives of how to ensure the best outcomes for all.
[***] FURTHER READINGS